


Space Weather Observations, Alerts, and Forecast
| Philippine Date/Time | Alert Message: |
|---|---|
| 2026-06-20 12:07 PM | ALERT: Type II Radio Emission Begin Time: 2026 Jun 20 0407 UTC Estimate Velocity: 300 km/s Comment: |
3-day Solar-Geophysical Forecast
Product: 3-Day Forecast
- Issued: 2026 Jun 20 0030 UTC
Prepared by the U.S. Dept. of Commerce, NOAA, Space Weather Prediction Center.
Geomagnetic Activity Observation and Forecast
The greatest observed 3 hr Kp over the past 24 hours was 3 (below NOAA Scale levels). The greatest expected 3 hr Kp for Jun 20-Jun 22 2026 is 3.67 (below NOAA Scale levels).
| Jun 20 | Jun 21 | Jun 22 | |
|---|---|---|---|
| 00-03UT | 2.67 | 2.67 | 1.67 |
| 03-06UT | 3.67 | 3.00 | 2.00 |
| 06-09UT | 2.67 | 3.00 | 1.67 |
| 09-12UT | 2.67 | 2.67 | 1.67 |
| 12-15UT | 1.67 | 1.67 | 1.00 |
| 15-18UT | 1.67 | 1.67 | 1.33 |
| 18-21UT | 2.67 | 1.67 | 0.67 |
| 21-00UT | 3.00 | 2.00 | 1.67 |
Rationale: No G1 (Minor) or greater geomagnetic storms are expected. No significant transient or recurrent solar wind features are forecast.
Solar Radiation Activity Observation and Forecast
Solar radiation, as observed by NOAA GOES-18 over the past 24 hours, was below S-scale storm level thresholds.
| Jun 20 | Jun 21 | Jun 22 | |
|---|---|---|---|
| S1 or greater | 1% | 1% | 1% |
Rationale: No S1 (Minor) or greater solar radiation storms are expected. No significant active region activity favorable for radiation storm production is forecast.
Radio Blackout Activity and Forecast
No radio blackouts were observed over the past 24 hours.
| Jun 20 | Jun 21 | Jun 22 | |
|---|---|---|---|
| R1-R2 | 15% | 15% | 15% |
| R3 or greater | 1% | 1% | 1% |
Rationale: There is a slight chance for R1 (Minor) radio blackouts on 20-22 Jun.
Real Time Images of the Sun
SOHO EIT 171
|
SOHO EIT 195
|
SOHO EIT 284
|
SOHO EIT 304
|
SDO/HMI Continuum
|
SDO/AIA Magnetogram
|
LASCO C2
|
LASCO C3
|
The sun is constantly monitored for sun spots and coronal mass ejections. EIT (Extreme ultraviolet Imaging Telescope) images the solar atmosphere at several wavelengths, and therefore, shows solar material at different temperatures. In the images taken at 304 Angstrom the bright material is at 60,000 to 80,000 degrees Kelvin. In those taken at 171 Angstrom, at 1 million degrees. 195 Angstrom images correspond to about 1.5 million Kelvin, 284 Angstrom to 2 million degrees. The hotter the temperature, the higher you look in the solar atmosphere.
Real Time Solar X-ray and Solar Wind
|
Sun Spots status for 30 Days |
Solar Cycle (mostly can determined every 3 - 13 yrs) |

Spaceweather Notifications and Timeline) |
Forecast KP Index 3 Days Advance |
Click here for much detailed View for X-Ray Chart Click here for much detailed View for Proton Chart
|
Derived Vertical TEC Derived Vertical Progression. |
Ionospheric / TEC Range Shows Ionospheric Range Error L1/m |
Auroral Activity Extrapolated from NOAA POES

Instruments on board the NOAA Polar-orbiting Operational Environmental Satellite (POES) continually monitor the power flux carried by the protons and electrons that produce aurora in the atmosphere. SWPC has developed a technique that uses the power flux observations obtained during a single pass of the satellite over a polar region (which takes about 25 minutes) to estimate the total power deposited in an entire polar region by these auroral particles. The power input estimate is converted to an auroral activity index that ranges from 1 to 10.

|
| Move your cursor over the timeline to 'scrub' through the forecast of Solar Wind's velocities. |
Radio Communications Impact
D REGION ABSORPTION PREDICTIONS (D-RAP) and VHF and HF Band Conditions

The D-Region Absorption Product addresses the operational impact of the solar X-ray flux and SEP events on HF radio communication.
Long-range communications using high frequency (HF) radio waves (3 - 30 MHz) depend on reflection of the signals in the ionosphere. Radio waves are
typically reflected near the peak of the F2 layer (~300 km altitude), but along the path to the F2 peak and back the radio wave signal suffers attenuation
due to absorption by the intervening ionosphere. The D-Region Absorption Prediction model is used as guidance to understand the HF radio degradation
and blackouts this can cause.
|
Credits:
Space Weather Images and Information (excluded from copyright) courtesy of:KP Index and Rational Meaning
Global TEC Maps (Unit:TECU)
TACC.CWA (Ionosphere and Space Atmosphere)
Australian Government Bureau of Meteorology
TAC CWB.gov
United States Total Electron Content by SWPC NOAA
NOAA / NWS Space Weather Prediction Center
Mauna Loa Solar Observatory (HAO/NCAR)
SOHO (ESA & NASA)
Sunspots (Sidc & NASA)
Space Weather links:
3-Day Forecast of Solar and Geophysical Activity
Space Weather Overview
LASCO Coronagraph
Real-Time Solar Wind
Space Weather Advisory Outlooks
Space Weather Forecast Disussions
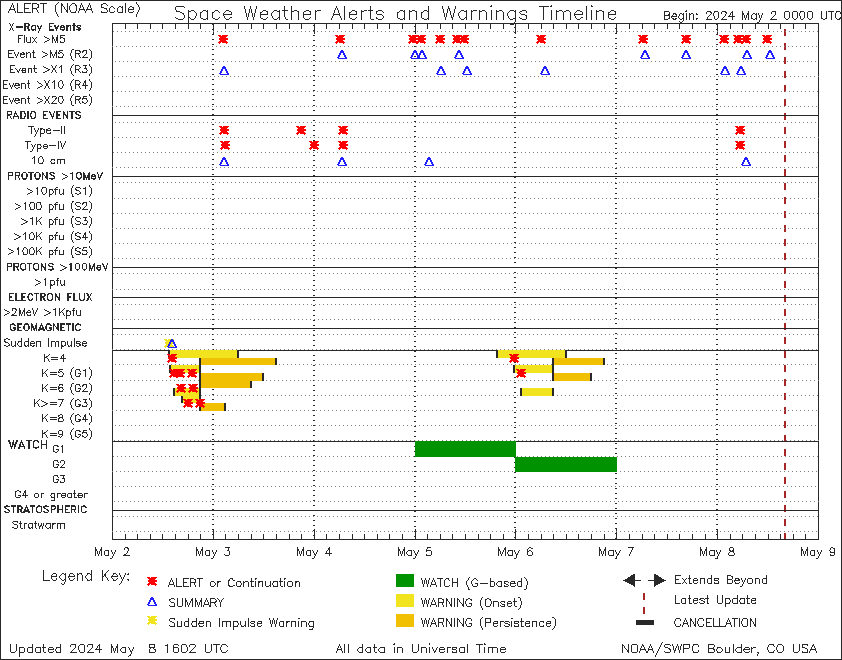
Space Weather Alerts, Watches and Warnings
Solar and Heliospheric Observatory (SOHO)
The Very Latest SOHO Images
Powered by Space Weather PHP script by Mike Challis
additions by Martin of Hebrides Weather and Ken True of Saratoga Weather
with 3-day Solar-Geophysical Forecast text formatting by Jeremy Dyde of Jerbils Weather
This is Pimoh Daimaoh's Personal Weather station, all data collected is based according to the initial readings from his sensors within the location in Baltazar St. Barangay #60 Caloocan City Philippines. Any comparisons that beyond from other weather sensor(s) readings may vary to its accuracy in different areas specially to compare this information to other weather agencies and amateurs may be differ from their initial records but very close as much as possible recordings. However, this may as accurate report as possible which may help this site as their another DATA information reference in the philippines so take note that never base important decisions that could result in harm to people or property on this weather information, this is just for additional data references.
|
|
|